pudding music challenge: comparing music knowledge 📻
May 6, 2020 00:00 · 1248 words · 6 minute read
First things first, I need to give away all the credit for this idea. Thanks to Namita (@nnstats on Twitter) since this blog post was fully inspired by this tweet.
had to graph my results from @puddingviz's delightful generational music challenge (https://t.co/6MBp6cdTla) and it turns out I started knowing what music was in ~2005 pic.twitter.com/AwxhPblwZd
— Namita (@nnstats) May 2, 2020
It was such a fun idea, I decided to do it too!
I love The Pudding. I think it’s an awesome website doing awesome things. This week they released a visual analysis of gaps in generational music knowledge. Before accessing the analysis, you can test your own music knowledge for any decade from 1960s-2010s. I thought this was super fun and after seeing Namita’s tweet where she plotted her own data, I figured this could make a fun little blogpost 😄.
Instead of just analyzing my own data though, I thought it would be fun to compare my knowledge to someone else my age. So I recruited my (semi-willing) boyfriend and we ended up spending an hour of our Saturday night quizzing ourselves on music (what else are we gonna do in quarantine anyway?).
The Pudding quiz gives you 10 random songs from the decade you choose. So to increase our sample, I had both of us do a quiz for each decade 3 times. So at the end we had tested ourselves on 30 hit songs from 8 decades. Here’s the resulting data:
pudding_data <-
  read_csv("pudding_music_challenge.csv") %>%
  mutate(knowledge = fct_inorder(knowledge))

pudding_data %>%
  sample_n(10) %>%
  kable() %>%
kable_styling()| song | artist | name | knowledge | year | year_dec |
|---|---|---|---|---|---|
| We Are Young | fun. Featuring Janelle Monae | J | singing the lyrics | 2012 | 2010 |
| Coward Of The County | Kenny Rogers | J | sounds familiar | 1980 | 1980 |
| When I Think Of You | Janet Jackson | J | don’t know it | 1986 | 1980 |
| Bad Blood | Taylor Swift Featuring Kendrick Lamar | M | singing the lyrics | 2015 | 2010 |
| Love Will Never Do | Janet Jackson | J | don’t know it | 1991 | 1990 |
| Stay | Maurice Williams and the Zodiacs | J | don’t know it | 1960 | 1960 |
| Disco Duck | Rick Dees | M | sounds familiar | 1976 | 1970 |
| Kryptonite | 3 Doors Down | J | know it | 2000 | 2000 |
| Good Thing | Fine Young Cannibals | M | don’t know it | 1989 | 1980 |
| P.I.M.P. | 50 Cent | J | know it | 2003 | 2000 |
If you’re interested in how I got this data, I copy+pasted our results from the Pudding music quiz into Excel and from there, I cleaned and structured the data in R. You can see the code here.
There were 4 knowledge levels to choose from in the Pudding quiz: don’t know it, sounds familiar, know it and singing the lyrics.
Note: I will be referencing my bf as “J” and me as “M” going forward.
Overall, how many songs did we get right?
pudding_data %>%
  add_count(name, name = 'total_songs') %>%
  filter(knowledge %in% c('know it', 'singing the lyrics')) %>%
  group_by(name) %>%
  count(name, total_songs, name = 'correct') %>%
  mutate(`% correct` = round(correct/total_songs, 2)) %>%
  kable() %>%
kable_styling()| name | total_songs | correct | % correct |
|---|---|---|---|
| J | 180 | 56 | 0.31 |
| M | 180 | 74 | 0.41 |
Yikes… Overall we failed. But since we belong to the youngest generation accounted for in this generational analysis, that can’t be too surprising?
But I’m not here to prove my unbeatable musical expertise. I’m only here to prove that I know more music than J and so far, we’re on the right track - Overall, I knew 10% more songs than J💁.
I used ggbeeswarm to visualize the results of all the songs we tested ourselves on. Where did we do better/worse? Do our results mirror each other’s or do they vastly differ?
set.seed(2016)
p <-
pudding_data %>%
ggplot(aes(year, knowledge)) +
geom_beeswarm(aes(color = name),
groupOnX = FALSE,
show.legend = F) +
labs(x = NULL, y = NULL) +
facet_wrap(.~name, ncol = 2) +
scale_x_continuous(breaks = scales::pretty_breaks()) +
scale_color_pjo(name = NULL)
p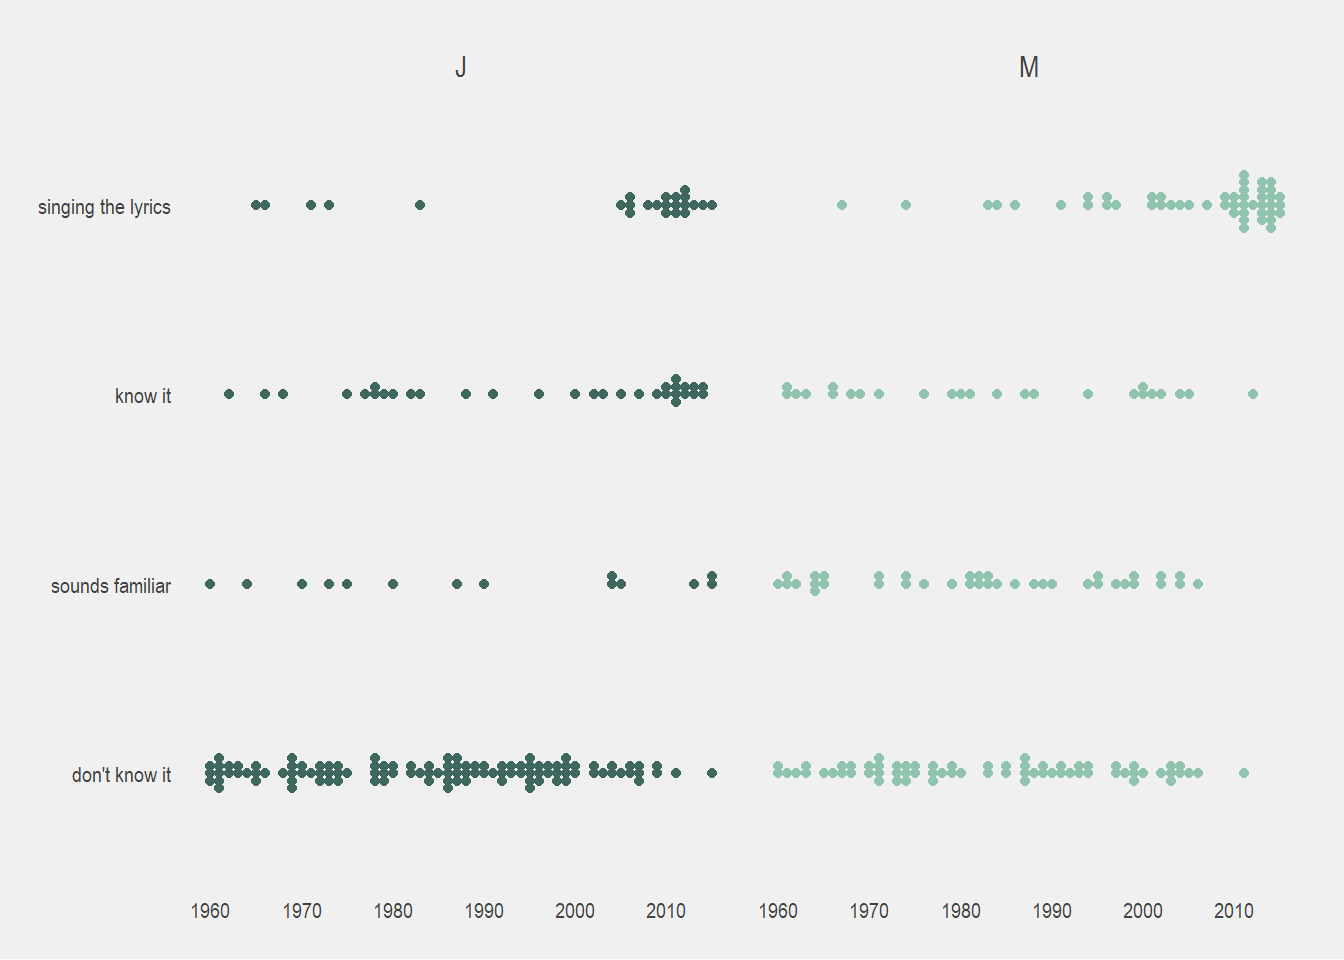 Our “don’t know it” data looks pretty full… I was honestly surprised how many songs we didn’t know! I’m not claiming to be some sort of expert but I thought I at least knew the hits from all these decades (whether through my own music or my parents). J was especially surprised with his results because he was raised on an overdose of classic rock radio stations.
Throwing a geom_smooth() on the plot, using method = loess, is helpful to see the years where we did better/worse.
p +
  geom_beeswarm(color = 'grey65',
                groupOnX = FALSE) +
  geom_smooth(aes(year, as.numeric(knowledge), color = name),
              method = 'loess',
              se = FALSE,
              size = 0.8)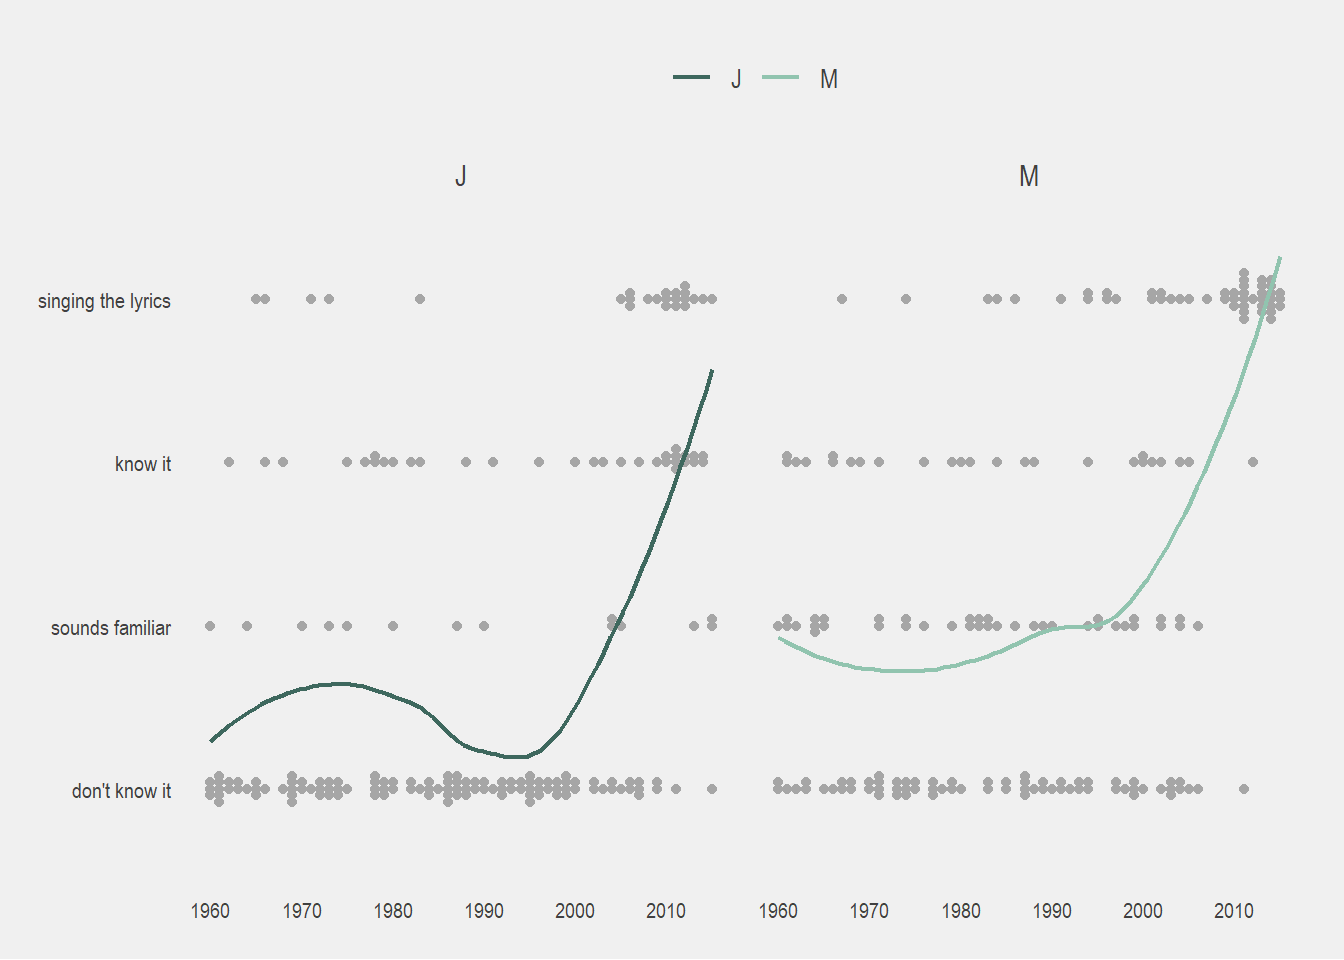
At a quick glance, our results look fairly similar (as you would expect of 2 people born in the same year).
You can see there’s an immediate increase in music recognition in the 2000s where we started to actually recognize the music we grew up with.
In general, it looks like J’s “don’t know it” is more saturated than mine. This could mean that I know more music overall and get bragging rights. However, where I listened to probably around ~30 seconds of each song, he was quick to click “don’t know it” after about 10 seconds, so this could also mean he missed parts of a song that he might have recognized.
There was a lot of stuff that sounded familiar to me but I couldn’t quite place, especially in the 1980s-1990s.
When we hit the 2000s, things stopped “sounding familiar” to me and I either just knew the song or I didn’t. Whereas J had songs that he couldn’t quite place over all the decades.
I think I was more liberal with the singing the lyrics option since to me generally knowing a song = knowing the lyrics. Considering that, J and I had pretty similar knowledge of the 2000s and 2010s.
I was curious to see the music that we knew from decade to decade (aka which decades can I boast more music knowledge than J), so I aggregated the “know it”s and the “singing it”s to visualize this.
decade_knowledge <-
  pudding_data %>%
  mutate(knowledge2 = ifelse(
    knowledge %in% c("don't know it", "sounds famililar"),
    "don't know it",
    "know it"
    )) %>%
  filter(knowledge2 == "know it") %>%
  count(name, year_dec) %>%
  mutate(percent = n/30)

decade_knowledge %>%
  ggplot(aes(year_dec, percent)) +
  geom_col(aes(fill = name),
           position = "dodge",
           width = 4) +
  labs(x = NULL, y = "% of songs known") +
  scale_y_continuous(labels = scales::percent_format()) +
  scale_x_continuous(
    breaks = c(1960, 1970, 1980, 1990, 2000, 2010),
    labels = c('60s', '70s', '80s', '90s', '00s', '10s')
    ) +
  scale_fill_pjo(name = NULL) +
  theme(legend.margin = margin(b = 5, unit = 'mm'),
        legend.key.width = unit(2, 'mm'))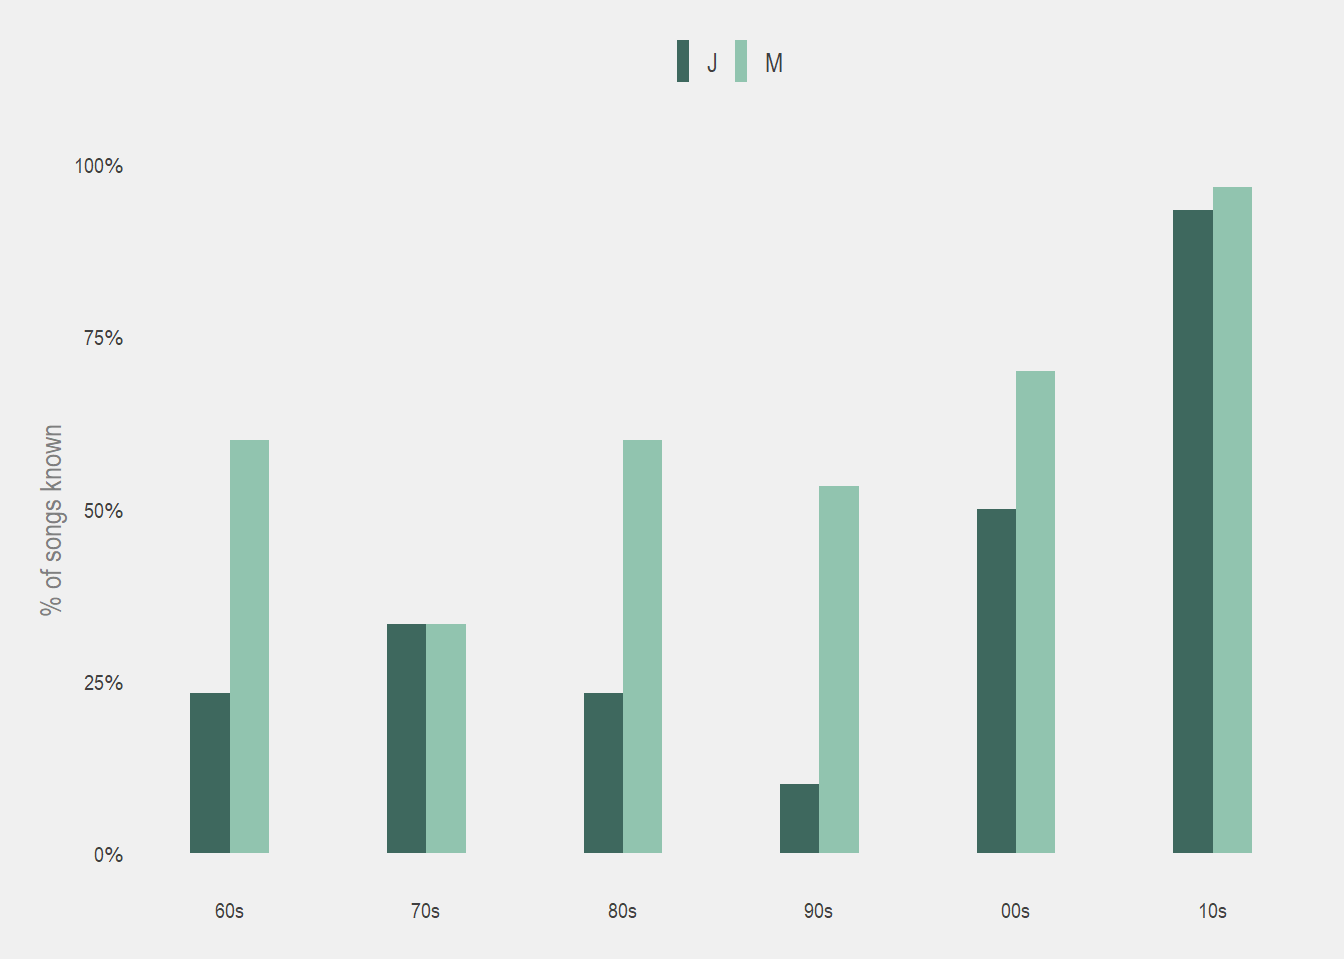
J is not at all familiar with the hit music of the 90s, only recognizing <15% of songs. This is a little surprising but also understandable I guess since we were born in the mid-late 90s.
I did surprisingly ok in the 60s (recognizing over 50% of songs!). Definitely not well 😅, but I was expecting that to be my worst decade. It turned out that I recognized the least music from the 70s (also a bit surprising to me, I thought the 70s would be my best decade pre-2000).
The only category where J came close to beating me was in the 70s, where we tied. So all in all, I think I get to pretty decisively take the win in all the decades otherwise (and bragging rights overall)!🏆
This was super fun to work on so thanks again to Namita for the awesome tweet+idea 😄. For any questions, comments, admonishments of my lacking music knowledge, etc, you can find me on twitter here.